When I talk to teachers about getting them to have their student write and publish online I talk about a number of things.
When you look at the research and writing process the last part of that process is publishing. Writing online is publishing beyond and providing a greater audience then just that of the teacher and possible peer edit that accorded as part of the process. It allows students to develop a public portfolio of their work and display that to a global audience.
By having student publish online on a blog you allow their work to receive multiple forms of feedback. A piece can receive written comments as well as being acknowledge via social channels through tweets, Likes and Pins. It opens up the assessment and feedback loop in a way that couldn’t happen within the confined of classroom and traditional publishing methods.
There are also the backend numbers that provide a level of feedback and analytic assessment.
Let’s look at two posts from my site which will tell two very different tales.
In April 2012 I posted “Considerations for deploying the AppleTV in your school or enterprise” and in May 2012 I reposted (originally on a different blog I no longer maintain) “The Breakfast Club library and John Hughes, both genius!“. I use GetClicky on my blog to keep track on the numbers and when you look at the numbers for these two posts you get a very interesting story.
Before we look that story let me first explain what we are going to be looking at so you understand what you are reading (NOTE: Different services define these terms differently, but the ideas are the same.)
- Time period: We are going to look at the past 28 days (relative to the writing of this post).
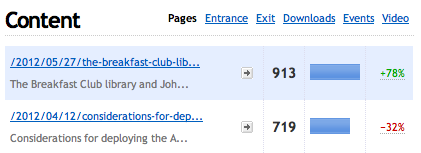
- Pages: The number of page views each post has in the specified time period.
- Visitors: The number of people who come to your site, including repeat visitors. Visitors are counted once per session, meaning of someone leaves your site and comes back later in the day or is idle on you site beyond the timeout period they will be counted again.
- Unique visitors: Are those visitor who visit your site in a given day. Visit the site once or five time in a day and you’re only counted once.
- Average time per visit: The amount of time spent on a post per visit.
- Bounce rate: Represents a visitor who stays on you site for more that 30 seconds or has more than one page view. For bounce rate the lower the percentage the better.
With these terms defined, in the technical sense, lets look at these two post and their numbers and see what type of assessment and feedback they give us.
By looking at the number of Page views each post had in the time period it would seem that the Breakfast Club/Library post did much better than the AppleTV post with 22% more views.
But let’s look a little deeper.
When you look beyond the views you begin to see a different story.
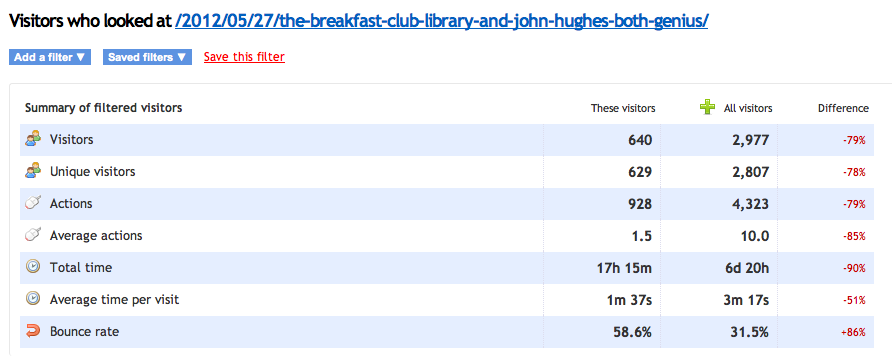
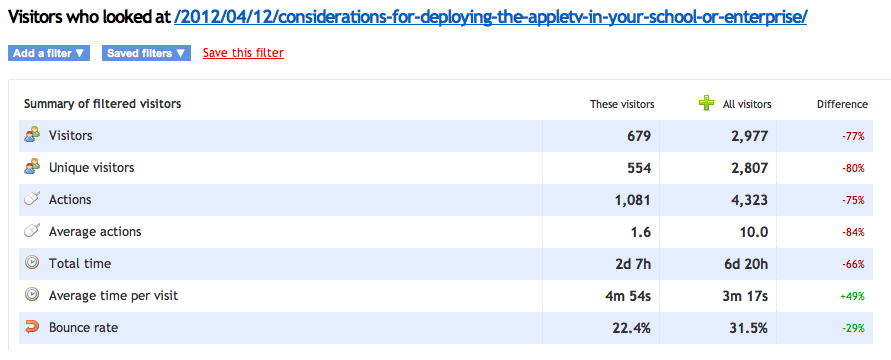
The overall number of “Visitors” to the posts actually favors the AppleTV post 679 to 640, however the number of “Unique visitors” favors the Breakfast Club post. What this could tell us is the more people returned to the Breakfast Club post over the time period specified. It would be one point in an engagement number.
The next thing to look at is the “Average time per visit” to see how long a visitor stayed on the post. This can be somewhat of a deceiving number as someone could load a page and sit idly on it, but with a large enough sample size this figure can be helpful as another engagement measure. Also, the length of a post – the time it will take to read it – will play into this score as well. You can also see the rate as it compares with the rest of the site.
The AppleTV post had an average time of 4 minutes 54 seconds, where the Breakfast Club post had only 1 minute 37 seconds. If your goal is to have people read what you wrote, take time to reflect on it and engage with the material (comment, tweet, Like or Pin – social engagement), then the AppleTV post wins hands down. Compared to the site average of 3 minutes 17 seconds you can also see that it quite handily beats the site average as well.
Bounce rate is on of those things that just doesn’t sound good. No one wants to get bounced, so you want to look for a low number here. At 22.4% for the AppleTV post and 58.6% for the Breakfast Club post you can see that AppleTV post stands out yet again. These rates compared to the site average of 31.5% also help indicate the engagement levels for each.
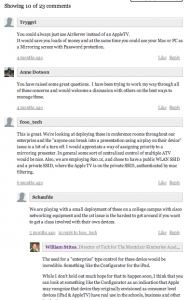
Comments are like gold! Even the briefest comment means that someone was moved (positively or negatively) by what you wrote to not only take the time to read your work, but comment on it.
When you have multiple comments or better yet a discussion forming around a particular piece you know that you’ve hit on something people are interested in.
The AppleTV post had 23 comments. Visitors were asking questions and I, as the author, when I had something to say in return did so. The Breakfast Club post had only 3 comments and they weren’t related to the content of the post.
This is not to say that a post with no comments didn’t do well, only that like the other measures, this is but one point of information to use in your conversations with students.
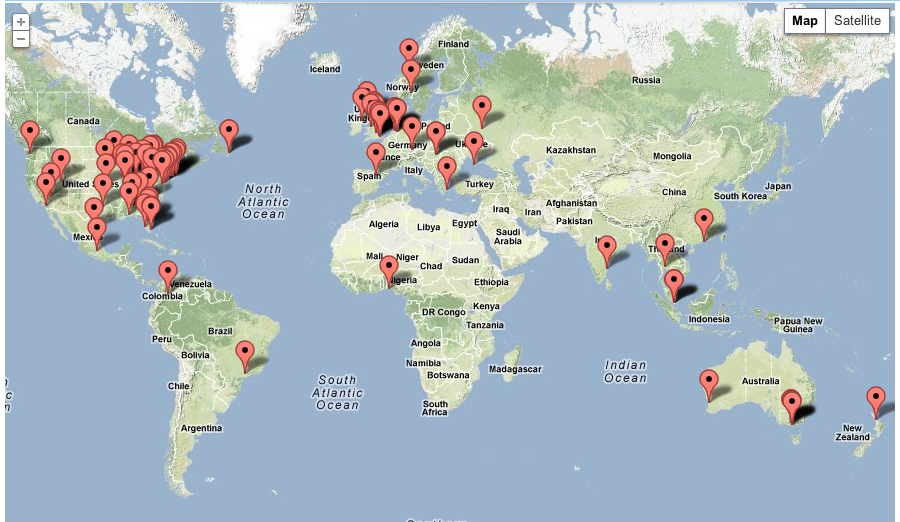
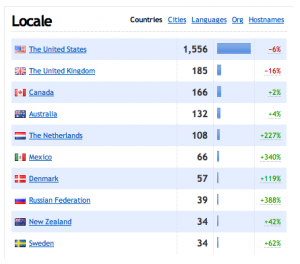 The last measure is that of Locale.
While this can requires a little more digging to get the information on each post it does show the reach that the work has. Unlike the other measure, locale doesn’t indicate the success of a post, but opens up a discussion about audience. By exposing students to the reach their work has, its global nature will allow them to understand that the world is not just the four walls of their classroom or dorm, but one much larger.
So what has our story taught us? What have we learned?
By writing online and having an understanding of analytic numbers at you can provide a level of assessment and feedback to written work in way a grade on a paper never could. That with any type of analysis you want to have multiple data points to look at and address. Lastly, I would say that even with all of these pieces at your disposal and the information you have, these are just bits of information.
My post, ‘The Breakfast Club library and John Hughes, both genius!” is a great observational piece on the configuration of the library set used in the film as a model for modern libraries to use when looking at space configurations to facilitate student learning and collaboration. The reason I think the post gets a lot of views, but scores poorly on the analytic side of things is that I think I have a great title an referenced a movie and director with a cult following.
This is what the numbers are telling me. What are your numbers telling you and do you think that what I am saying makes sense? Please leave me some gold below!
Some related posts:
- Why Social Media in School? – My post on edSocialMedia discussing students voice (7/2011).
- Bill’s Model and the “Long Class” of Writers – Steve Valentine’s take on the topic (2/2011).
- Statistics to tell the Story with Students – My earlier thoughts on the subject (11/2010).

